While the Travel Survey gives us an understanding of where and how people tend to move around, and the out of home inventory that they are exposed to, the next stage is to incorporate census level volumetric data so that we can model out the total numbers in a sensible manner.
In order to do this, Route ingests myriad data from a huge array of data sources. The commonality across them being that they give a volume of traffic (pedestrian or vehicular) at a known location.
Examples of the inputs used include (but are not limited to) …
These data are input to Route’s Traffic Intensity Models which take the volumes and assign them to a known location on the HERE mapping architecture. Using proprietary routing algorithms and combining this with a gravity model the data are modelled out to calculate ‘flow’ volumes on all ‘links’ (road segments or pathway segments).
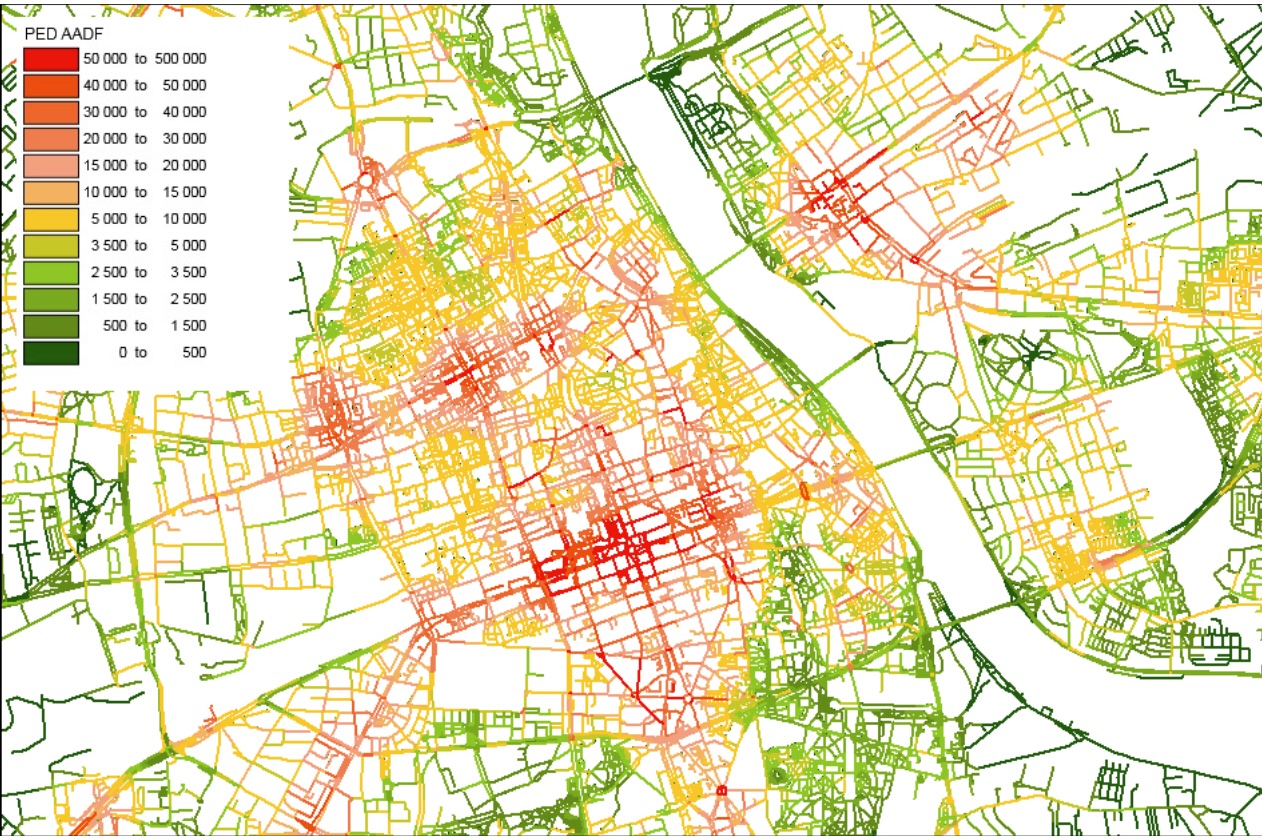
Separate models exist to calculate these flow volumes for pedestrians and vehicles.
Many inputs to the Traffic Intensity Model are refreshed on an annual basis to ensure that the data are as contemporary as possible, however by the nature of these data, they are only made available a year in arrears. The current baselines for most volume inputs are from 2022.
Keeping volumes contemporary
While the Traffic Intensity Model outputs typical flows on links, it is only updated once per year which is not sensitive enough to account for differences in volumes through time.
To ensure that the audience data Route produces best reflects volumes of people on the street in the here and now, Route has developed a volumetric moderation model which we fondly refer to as the ‘contemporisation process’.
In a nutshell this process takes in more recent volumetric inputs (where available) and compares them against the same period in the baseline year to create a contemporisation factor which can be applied to the audiences.
For example, if an underground station in Q1 2022 had an average tap in/ out volume of 100,000 in a week, then this would be used as the total volume of people who used it in a week. Yet, if, in Q1 2024 the volume increases to 130,000 per week (perhaps as result of an ABBA experience venue opening nearby), then it makes sense to reflect this change in audience as soon as possible. Therefore, what we do is compare the volume in 2022 (baseline volume) and the Q1 2024 volume (contemporary volume). This would give us a factor of 1.3 (130k / 100k = 1.3). This contemporisation factor is then fed into the Route audience algorithm to moderate the volumes up or down accordingly. This process is done as standard.
Note: Not all contemporisation factors increase audiences.
Further Reading:
Ipsos has produced a technical report on the Traffic Intensity Model for those that way inclined. You can read a copy of this here.

