Route is an attention-based currency, meaning that it does not operate on an ‘opportunity to see’ basis (OTS) for advertising, but instead adjusts audiences based on the likelihood of seeing the ads (LTS) which people are exposed to.
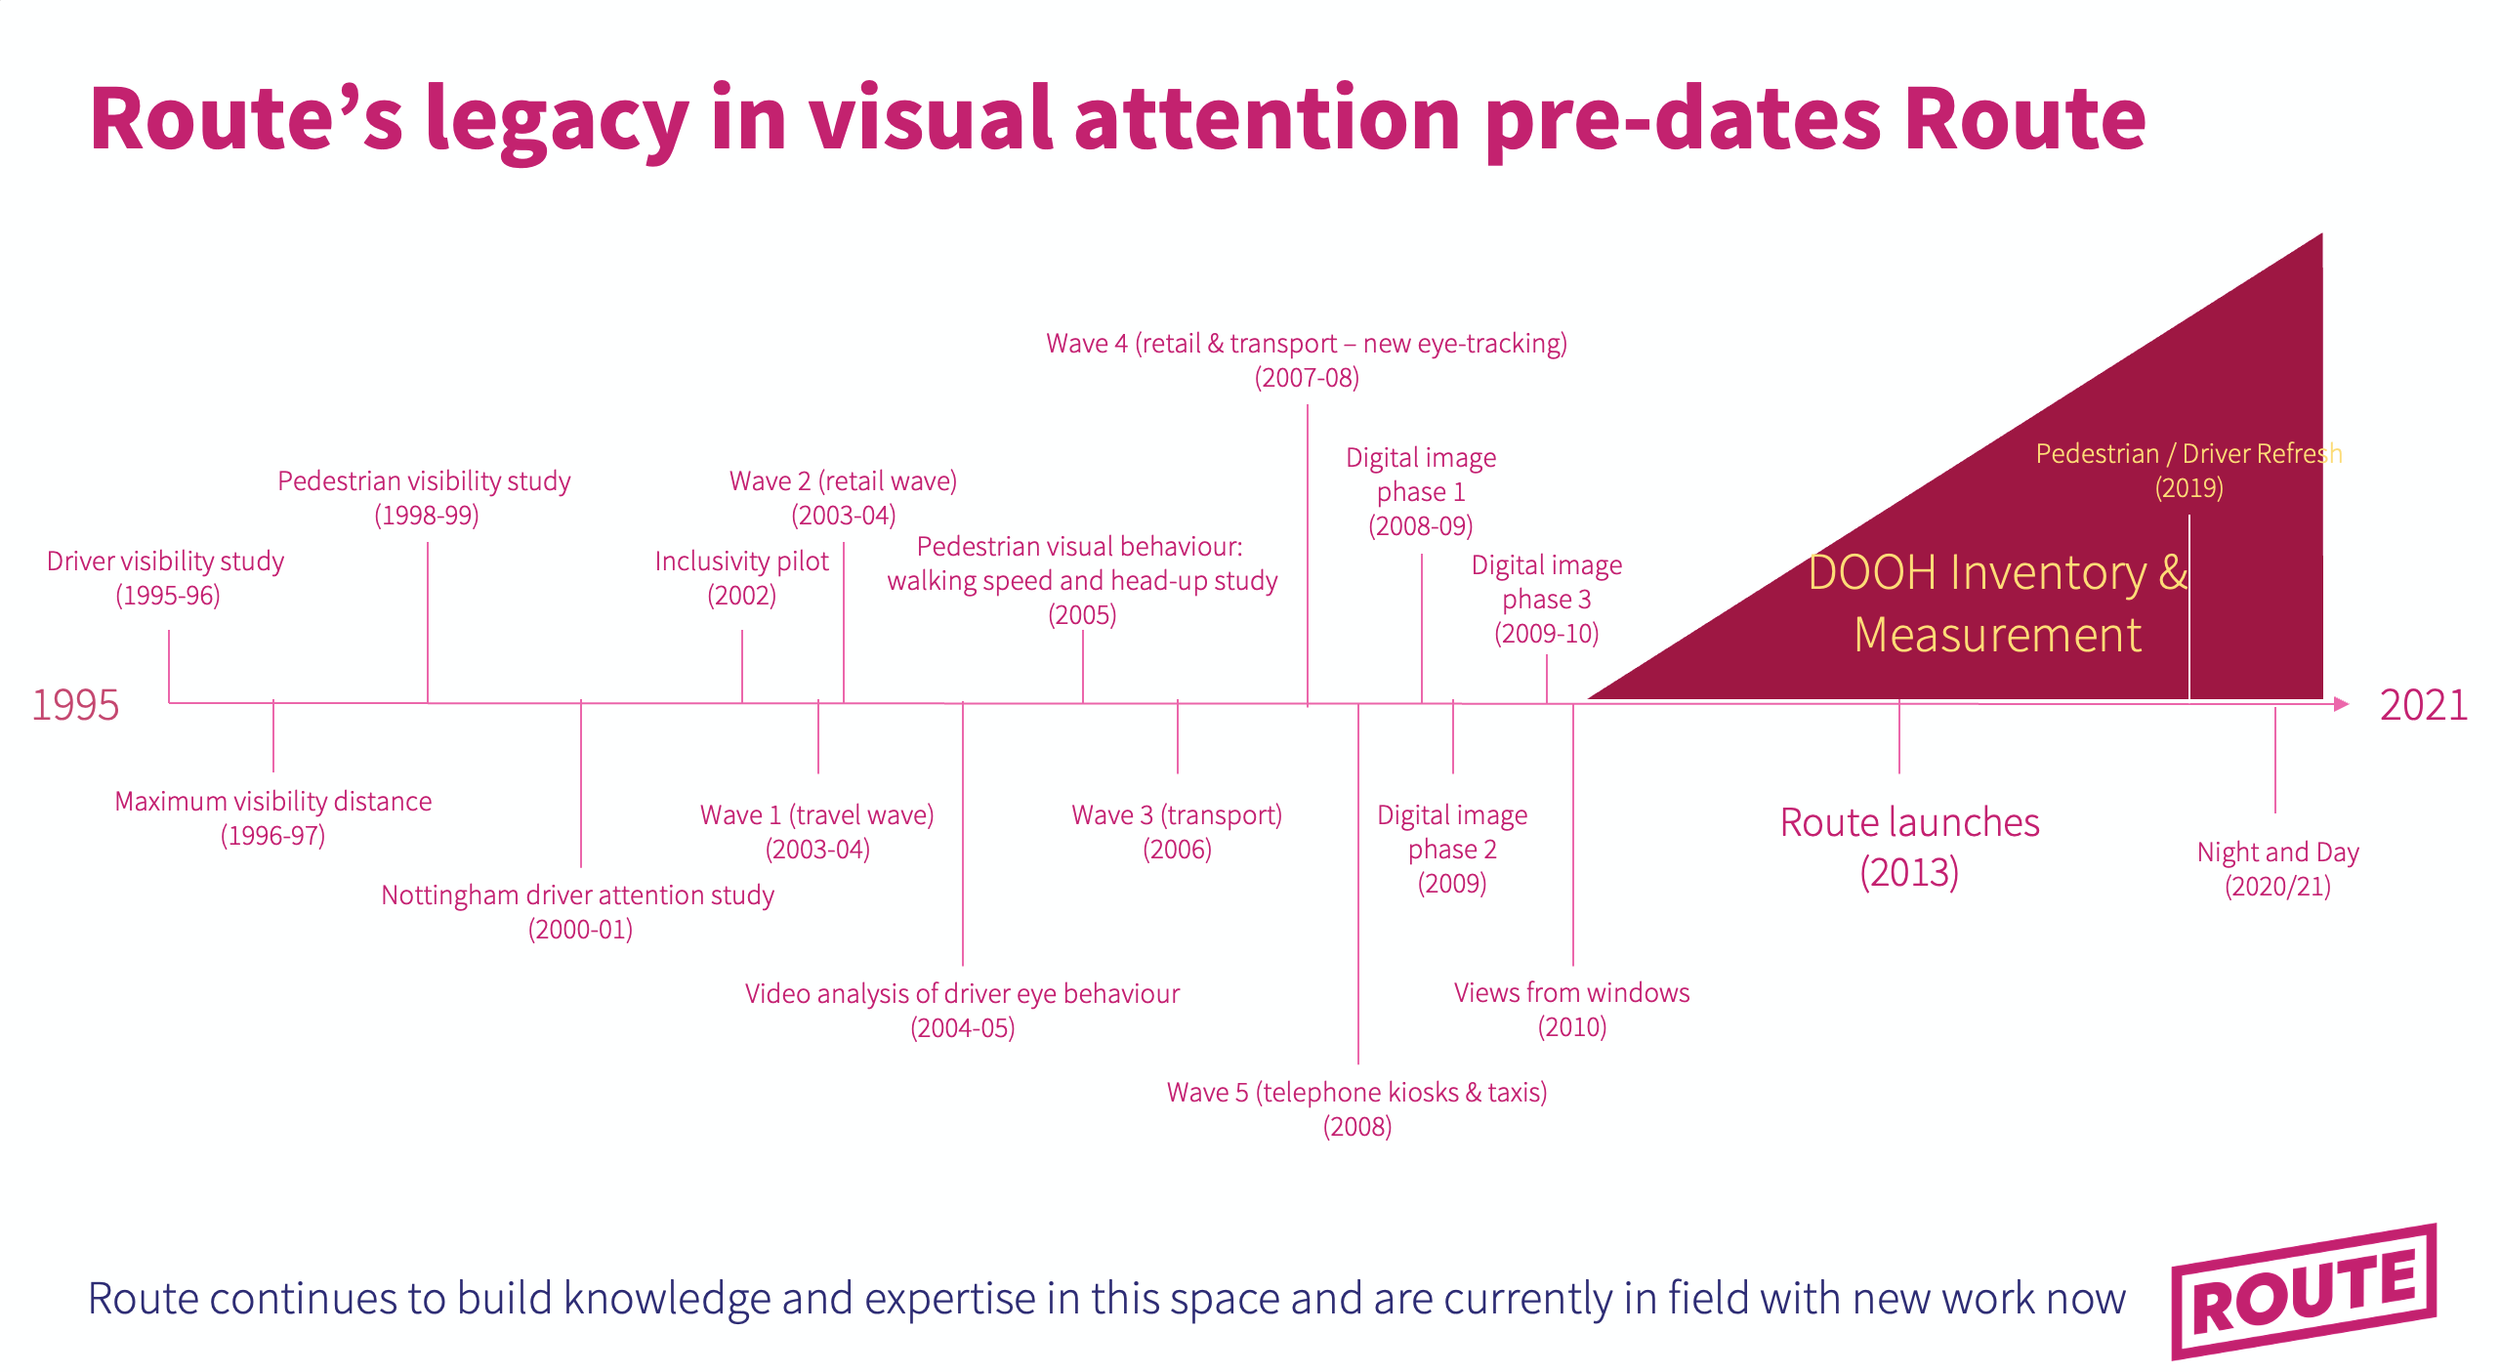
This is done through the implementation of a visibility adjustment algorithm which itself is derived from a variety of eye tracking research studies conducted over a period of 25 years+.
Eye tracking research informs Route audiences in two key ways.
How far can an OOH ad be seen from?
One of the first studies in this space which Route (nee Postar) completed was to establish a formula to determine the maximum distance from where an OOH ad can be seen from. This distance is based on the overall surface area of the poster or screen and extends out in a cone of 120 degrees from either side of the ad creating a ‘visibility area’.
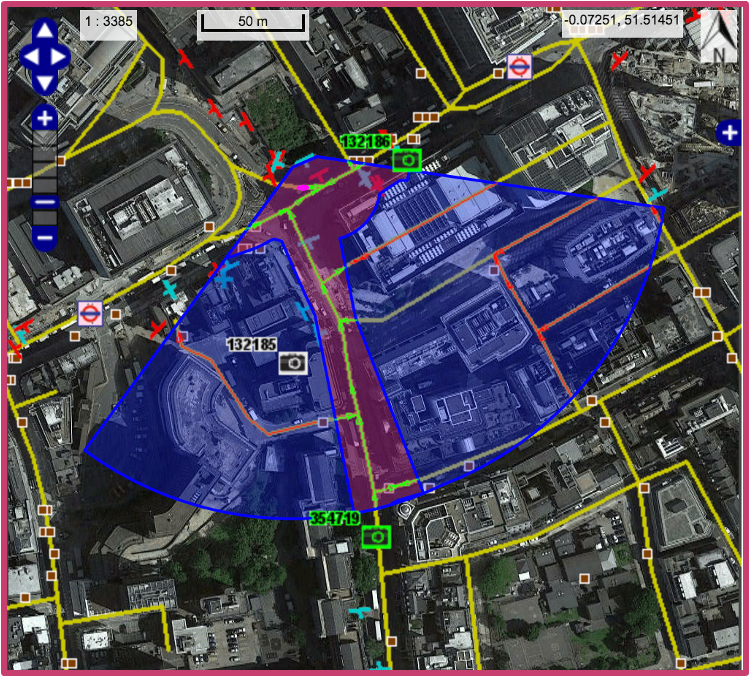
Although the visibility area extends to a maximum distance, the reality is that various immovable objects (buildings, walls etc) exist within this space. As a result, our partners at Ipsos run a process which accounts for these and generates a ‘realistic’ visibility area for all inventory which we measure.
This in effect gives us our ‘catchment’ area for each poster or screen and so the people travelling through these areas in the direction of the ad, can potential start building audiences.
What affects the likelihood of seeing an OOH ad?
The basic principle is that we want to work out, for each person entering into an area from where it is possible to see OOH ads (visibility areas), how likely they are to have seen it.
The various research studies which Postar and Route have done, alongside Paul Barber at Birkbeck College, TNS (now Kantar) and more recently Lumen have all featured eye tracking work in different situations, with different stimulus materials and all of which set out to quantify the hit rates on posters or digital screens across different exposure types.
Through this work and previous academic literary reviews a number of factors have been identified which affect the likelihood of seeing something…
Each of these together generate the momentary hit rate or the likelihood that that ad has been seen.
The momentary hit rate is calculated for every 0.1 seconds that people spend within a visibility area and then aggregated. In other words, every 100 milliseconds that people are exposed to an ad, we calculate the size, distance they are from it, the distance it is offset from their line of travel and the distortion angle between the ad and them and combine it to create a likelihood of seeing at that time.
This is then aggregated for the full exposure time. The principle being that the longer you spend within a visibility area, the higher the likelihood of seeing the ad. This is sometimes referenced as the VAC (visibility adjusted contacts).
Each person’s VAC is then aggregated at a frame level to give an overall likelihood of seeing that frame for all the people in cars or on foot who are exposed to the ad.
The speed that the likelihood of seeing builds over time is determined by a constant factor (k). Separate k values are applied to different behaviours and frame types as these have been found in our research have different visibility build speeds (they are differentiators in the likelihood of getting seen).
Currently Route has different k values for pedestrians and vehicular audiences, and for those being exposed to ads fixed in the ground or ads on buses and taxis. In total we have curves built around the following dynamics:
Within our core equation we treat everything as a poster in normal daylight conditions and go through the above-mentioned process to calculate the Visibility Adjustment at a contact level.
However, then at the end of the exposure level calculation there are a few other considerations which are then accounted for.
There is an accounting for illumination. Not all posters are illuminated which means that in hours of darkness they are less viewable (particularly from distance). Until our most recent studies, unilluminated inventory during hours of darkness (which are defined according to the region and month) were subject to a significant penalty factor, though more recent studies in this area with Lumen included more modern technology which improved the stimulus material and this has led to reduced penalty factors being applied to unlit posters after dark. Digital inventory receives a factor greater than 1 in this step, however this is not a sliding scale where greater brightness leads to greater factors.
Subsequent research has seen Route / Postar investigate the effect of dynamic content in ads on the overall hit rate. This is dealt with as a factor which is applied at the end of the calculation. The dynamic factor applies to all inventory for which the ads are not static over a fixed period. This means it applies to all digital screens and to scrolling posters. There are two factors which are applied, these depend on the surface area of the ad. A dynamic ad with a surface area over 16.8m^2 is given a factor of 1.5 to the standard VA. A dynamic ad smaller than this receives a factor of 1.2.
All the contacts are then aggregated to give an overall frame level visibility adjustment factor that is applied to the total traffic who pass through the visibility area to give a measure of impacts.
So, in summary…
The principle stems from a long line of academic research which has separately tested the effects of various factors on the likelihood of seeing something. For every 0.1 second that people are in a visibility area, we calculate their proximity to the ad and establish a likelihood of seeing the ad.
We apply extra calibrations to account for dynamic content and illumination levels.
The likelihood of seeing is plotted on a curve which is controlled by a constant k that varies depending on the mode of transport and the ad type which is being exposed to
The likelihood of seeing is first aggregated at a contact level and then subsequently at a frame level and applied to the total volume of traffic passing through the visibility area to arrive at impact numbers
What this means for the data
This gives an audience measure that goes beyond ‘impressions’ and allows us to determine not just how many ads are displayed on OOH screens, nor a count of those exposed to the ads, but instead a measure of those who are actually likely to see the ads which they are exposed to.
Why is this important?
This gives advertisers the truest measure of their advertising audience. It offers transparency in terms of the audience numbers. Advertisers can have confidence in the number of people who actually see their ads, rather than have a chance to see them.
Further reading:
Visibility: Object visibility in dynamic scenes [link]
Visibility: estimating the visibility of poster panels for pedestrians [link]
Postar Visibility Research: An integrative eye-tracking study of visibility hot rates for poster panelsin UK environments [link]
“Seeing is believing” presentation [download]

